

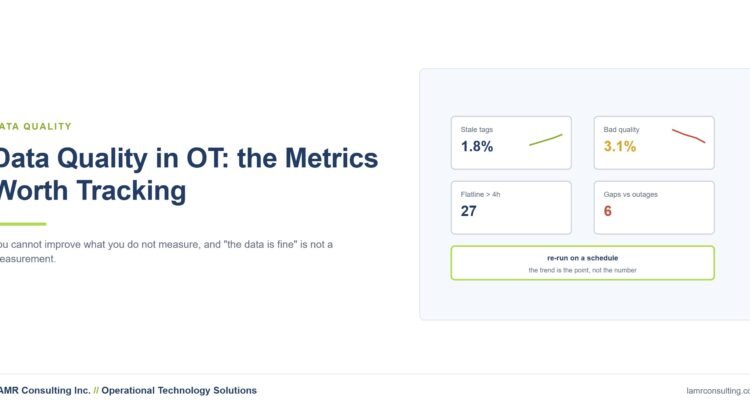
Data Quality in Operational Technology: the Metrics Worth Tracking
Ask whether the historian data is good and you will usually get a confident yes, followed by a list of tags people do not trust. Both halves of that answer are informative, and neither is a measurement.
These are the metrics we find worth tracking, chosen because each one is cheap to compute, maps to a specific failure, and can be re-run later to show whether anything improved.
Staleness
The proportion of tags whose last value is older than their expected update interval. Stale tags are the most common serious defect and the easiest to detect. The expected interval has to come from the asset model — a once-daily lab result is not stale at six hours, and a one-second process tag is.
Flatline duration
The longest run of identical values per tag, relative to what is plausible for that measurement. A genuinely stable process produces small variation. A perfectly constant value over hours usually means a failed transmitter reporting its last reading, or an interface that stopped without anyone noticing.
Bad quality proportion
The share of values carrying bad or questionable quality, trended over time. The absolute number matters less than the direction. A tag drifting from 0.1% to 3% bad quality over six months is telling you something about an instrument before it fails outright.
Gap analysis against interface events
Gaps in history correlated against interface restarts and network events. Gaps that line up with known outages indicate buffering that is not working. This is the metric that most often finds a problem nobody knew they had.
Compression effectiveness
Values stored versus values received, per tag class. Outliers in both directions are worth attention: tags storing almost everything suggest compression is not working as intended, and tags storing almost nothing may be discarding detail somebody needs.
Timestamp sanity
Values arriving with future timestamps, out-of-order arrivals beyond the expected window, and clustering at exact second boundaries where the instrument should produce finer resolution. Each indicates a clock or configuration problem somewhere upstream.
Model integrity
Attributes resolving to non-existent or non-updating points. Analyses that have not produced output within their expected period. Elements with no data at all. These are the AF equivalents of staleness, and because AF generally fails silently, they are invisible until measured.
Making it routine
The value is not in running these once. It is in running them on a schedule, publishing the trend, and giving the numbers an owner. A quality dashboard that engineers check alongside process displays changes behaviour in a way that an audit report filed in a shared drive does not.
It also gives any downstream analytics programme something it otherwise lacks: a defensible answer to “how good is this data?” that is not an opinion. We establish these as part of an audit.