

AMI Data at Scale: Why Conventional Tooling Gives Up
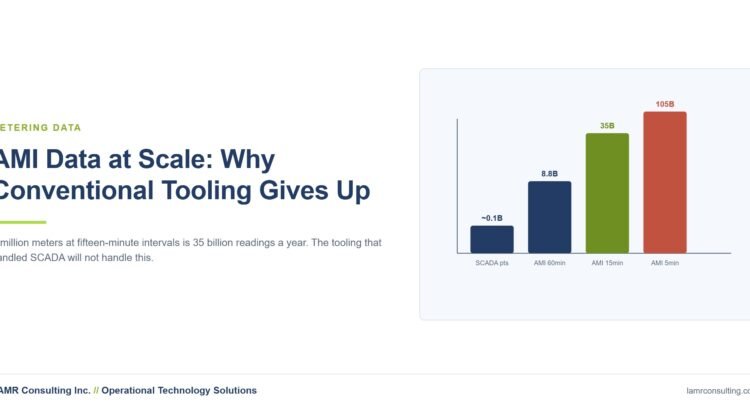
Advanced metering infrastructure changed the arithmetic of utility data. A distribution utility with a million meters reading at fifteen-minute intervals generates roughly 35 billion readings a year. At five-minute intervals it is over 100 billion.
For comparison, a large SCADA estate might historise a few hundred thousand points. The tooling, habits and instincts developed for one do not transfer to the other.
What breaks first
- Row-oriented storage. Billions of narrow rows in a relational database is the wrong shape. Queries that worked on millions take minutes or fail.
- Per-meter processing. Logic written as a loop over meters is fine for a thousand and hopeless for a million.
- Nightly batch windows. Processing that comfortably finished overnight stops fitting in the window, and the backlog compounds.
- Reporting that scans everything. Without partitioning and clustering aligned to how people actually query, every question reads the whole dataset.
The characteristics that actually matter
AMI data is extremely regular — fixed interval, known schema, predictable volume — which makes it well suited to columnar storage and partitioning. It is also extremely repetitive, so it compresses well. These are the properties lakehouse platforms were built around, which is why utilities keep arriving at that architecture regardless of where they started.
It is also incomplete in characteristic ways. Meters miss reads, communicate late, get replaced, and occasionally report implausible values. Estimation and validation rules (VEE) are part of the data, not an afterthought — and whether a reading is actual or estimated needs to travel with it, because billing and engineering analysis treat them differently.
Where the value actually is
Billing determination is the obvious use and the least interesting. The operational value sits elsewhere: transformer loading inferred from the meters beneath it, phase identification and unbalance, outage detection and restoration confirmation from last-gasp messages, voltage profiles along a feeder, and identifying where distributed generation is quietly changing the load shape.
Every one of those requires joining meter data to network topology — which meter sits under which transformer, on which phase, on which feeder. That topology is usually held in the GIS, is usually somewhat wrong, and is almost always the limiting factor. Getting it correct and keeping it correct is the unglamorous work that determines whether any of the rest is possible.
Sequencing it sensibly
Land the raw interval data at full fidelity before deciding what to do with it. Establish the topology join early and measure its accuracy. Treat VEE status as a first-class attribute. Only then start building the analytics, because every one of them depends on those three things being right.